

Q3:
Cambridge IGCSE Mathematics - International - 0607 - Core Paper 3 2019 Summer Zone 2
 Share
Share


Questions:
3/13

Topic: CH11 - Statistics


Solution

PRACTISE
Similar Questions

LEARN
Concepts with Sparky

More Questions from this Topic
Theory
CH11 - Statistics
The scatter diagram shows the marks of 10 students in a mathematics test and in a physics test.
(a) What type of correlation is shown on the scatt...
 Summer
 13
13
Theory
CH11 - Statistics
The cumulative frequency diagram shows the scores of 60 students in an English test.
Find
(a) the median,
Answer(a) ................................
Summer
7
Theory
CH11 - Statistics
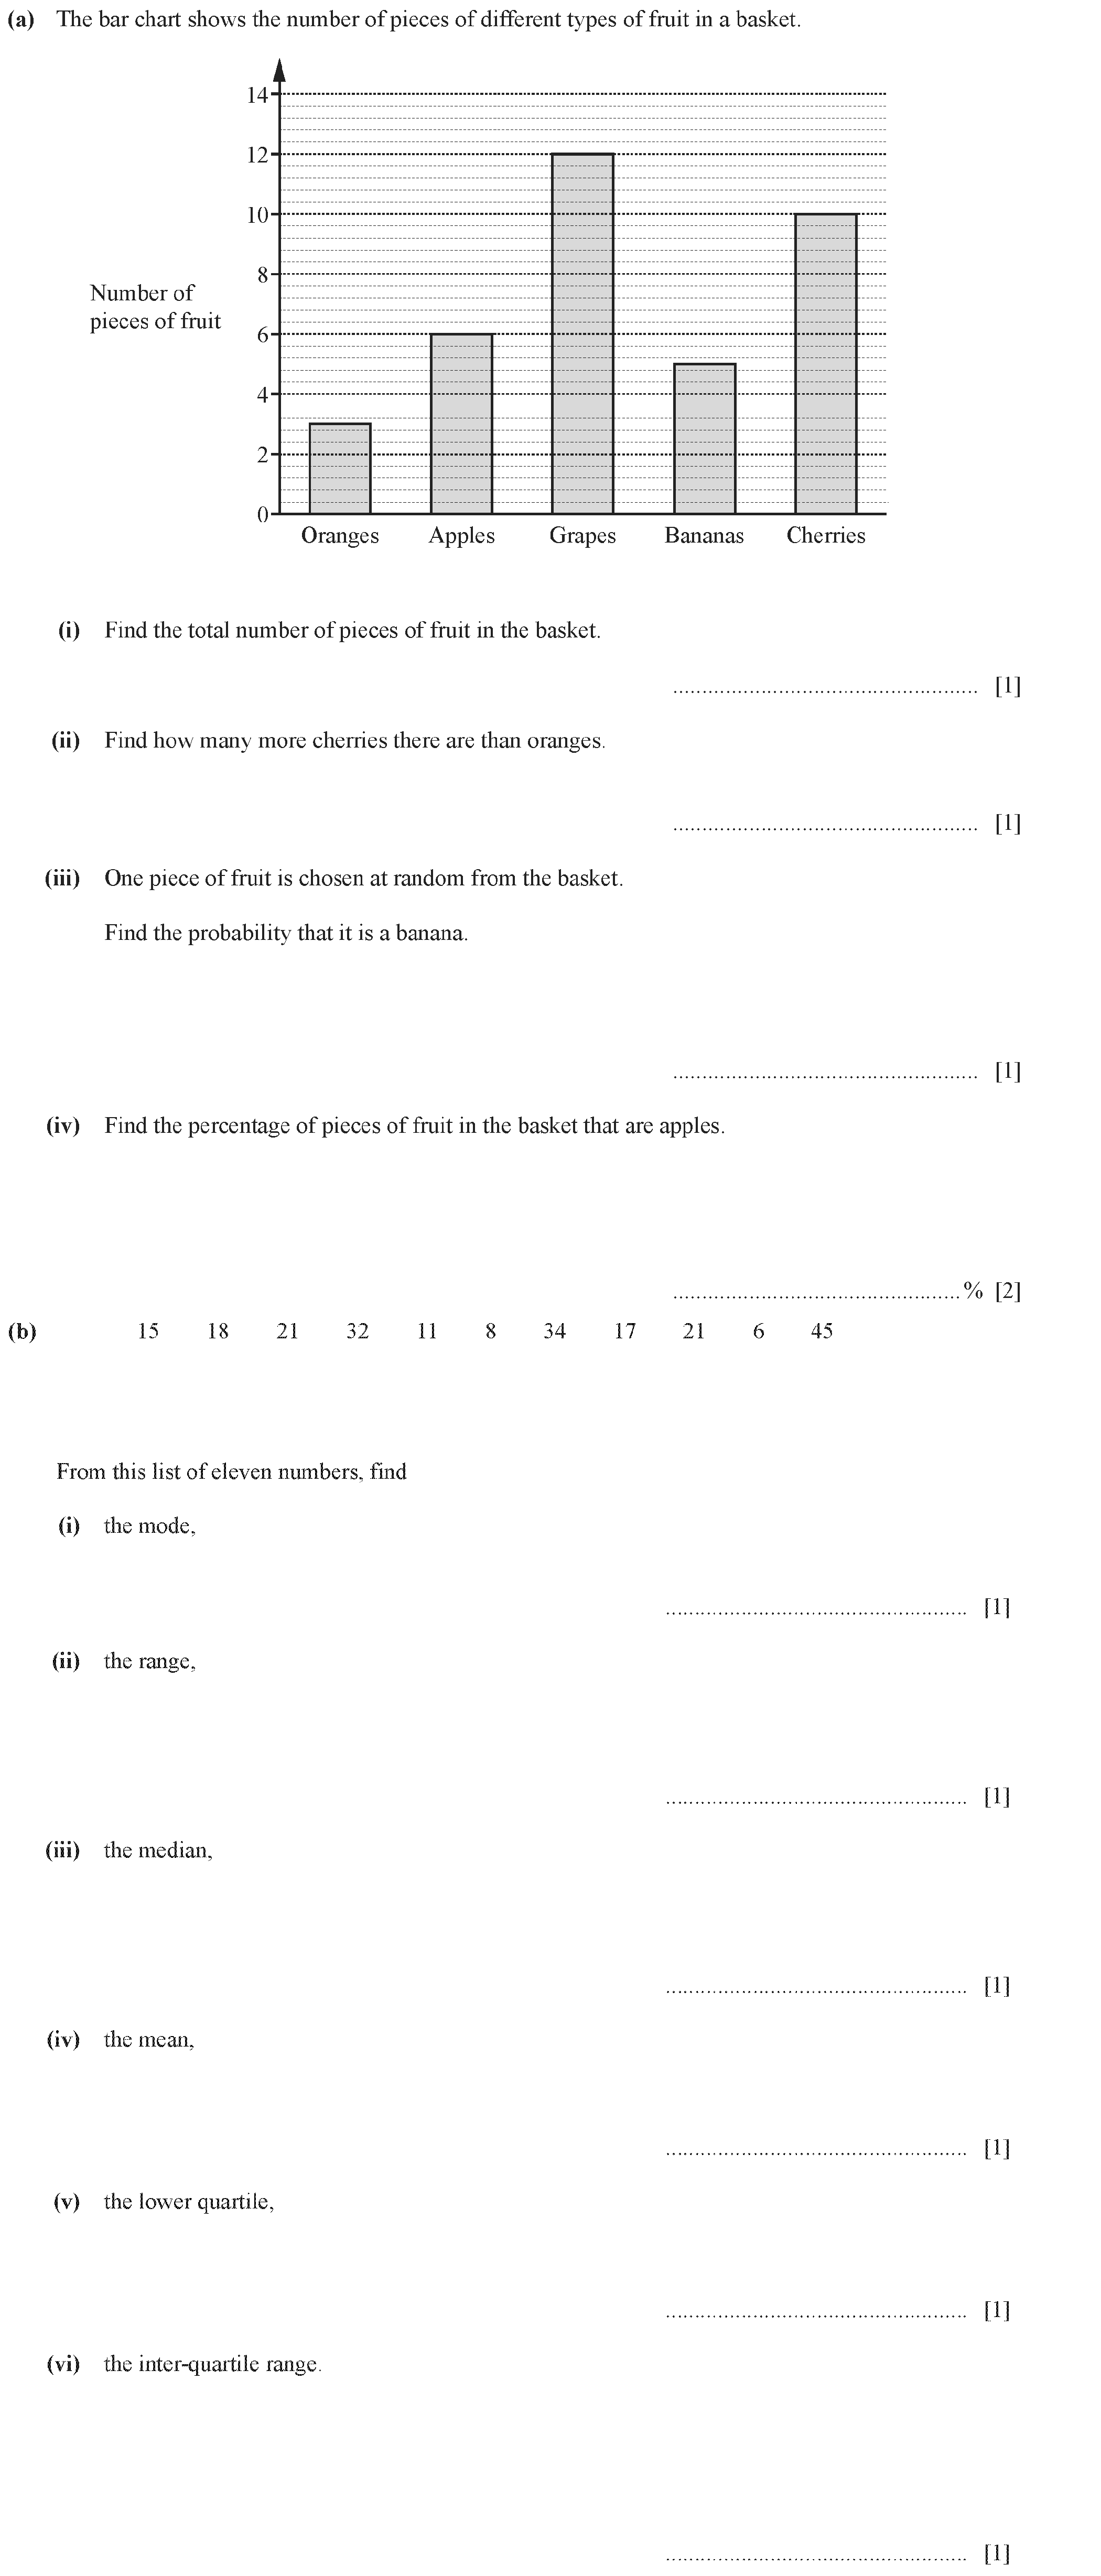
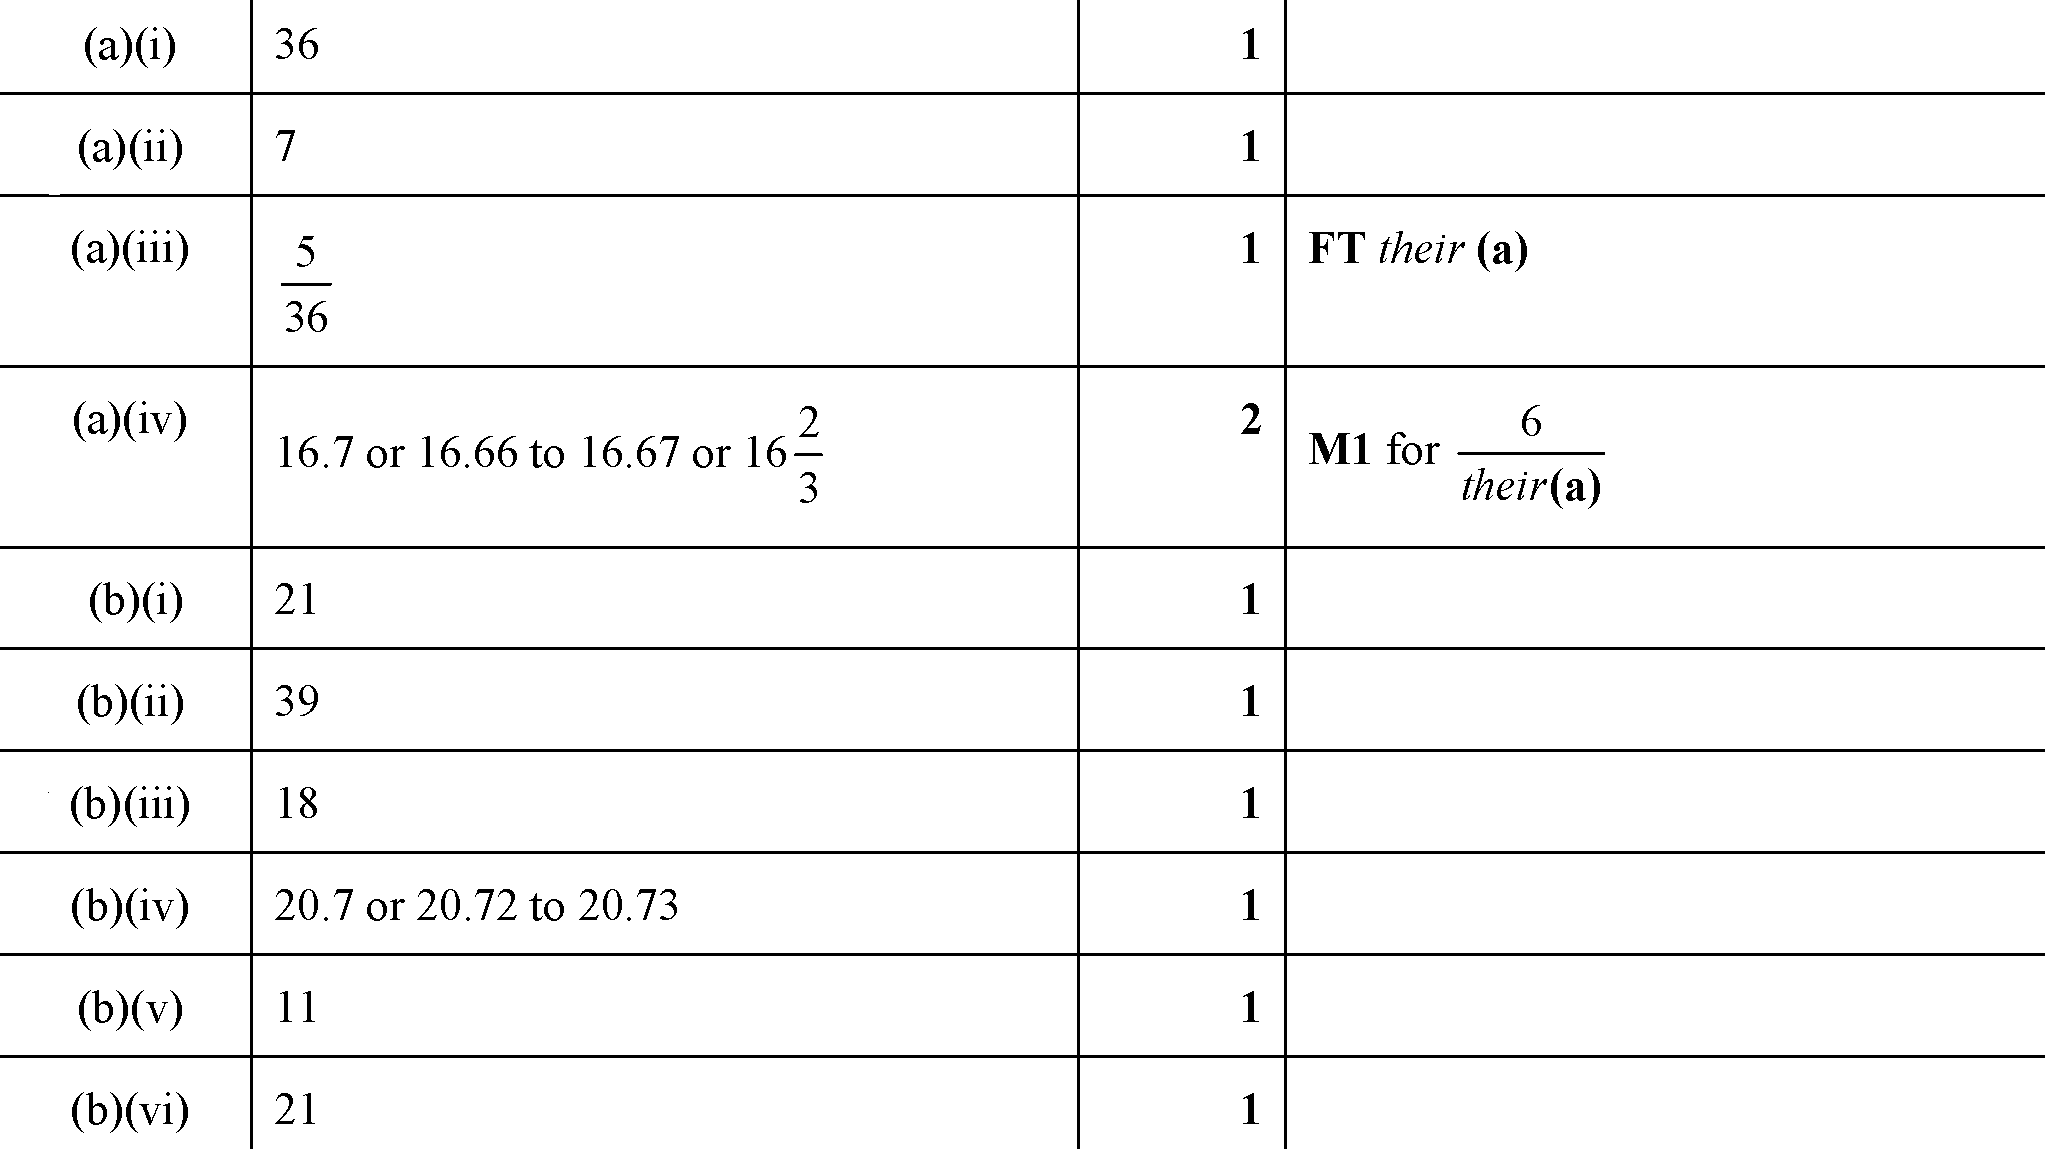
A list of numbers is shown below.5 \ 8 \ 6 \ 2 \ 8 \ 4 \ 5 \ 8(a) For the list of numbers, find(i) the mode,Answer(a)(i) ................................
Summer
3
Theory
CH11 - Statistics
The diagram shows how Ken’s mass, in kilograms, has increased with his age, in years.(a) Write down Ken’s mass when he was 6 years old. .............
Summer
5
Theory
CH11 - Statistics
Raphael is drawing a pie chart for the time, $t$ minutes, that 90 students spend on the internet each day.[Table_1](a) Complete the table to show the ...
Summer
2
Theory
CH11 - Statistics
Data has been collected about the age (years) and the value (to the nearest $100) of the cars owned by a class of University students.| Age (years) | ...
 Winter
7
Winter
7
Theory
CH11 - Statistics
A farmer picks a bunch of grapes.He writes downA the colour of the grapesB the number of grapesC the weight of the grapesD which plant the grapes were...
Winter
2
Theory
CH11 - Statistics
The total cost of a holiday was $720.The pie chart shows how this money was spent.Find the amount of money spent on(a) food,Answer (a) $ \text{...
Winter
3
Theory
CH11 - Statistics
Romina opens 10 packets of biscuits and counts the number of biscuits in each packet. The number of biscuits in each packet is shown below.23 24 23 22...
Winter
2
Theory
CH11 - Statistics
What type of correlation is shown in each scatter diagram?
Winter
2
More Questions from year 2019
Theory
CH1 - Number
Write 36247 correct to the nearest thousand.
Summer
2
Theory
CH1 - Number
Write down three multiples of 12. ..................., ..................., ................... [1]
Summer
2
Theory
CH5 - Geometry
The diagram shows a circle centre $O$ and three lines, $OA$, $AB$ and $CD$.Write down the line that is(a) a chord, ......................................
Summer
7
Theory
CH1 - Number
The cost, in dollars, of a taxi journey is $2 \times (\text{number of kilometres travelled}) + 10$.Find the cost of a taxi journey of 30 kilometres.$ ...
Summer
2
Theory
CH1 - Number
Change 2.4 metres into millimetres.
..................... mm [1]
Summer
2
Theory
CH5 - Geometry
(a) Find the value of $x$. $x - \text{................................................} \ [1]$(b) Find the value of $y$. $y = \text{...................
Summer
2
Theory
CH1 - Number
Write down all the integers that satisfy the inequality shown on this number line.
Summer
2
Theory
CH1 - Number
(a) Work out $\frac{3}{8}$ of 16. .......................................................... [1](b) Write $\frac{1}{20}$ as a percentage. ...............
Summer
2
Theory
CH7 - Mensuration
Work out the area of this shape....................................... $\text{cm}^2$ [3]
Summer
2
Theory
CH11 - Statistics
Huda is drawing a pie chart for the times, in minutes, that 60 students take to travel to school.[Table_1]Time \((t\text{ minutes})\) | Frequency | An...
Summer
2

